Guest viewing is limited
- You have a limited number of page views remaining
- 4 guest views remaining
- Register now to remove this limitation
You are using an out of date browser. It may not display this or other websites correctly.
You should upgrade or use an alternative browser.
You should upgrade or use an alternative browser.
Helpful Charts
- Thread starter Phylex
- Start date
VPD Chart

I'm a soil guy but recently ventured into hydro. This chart was clutch for me. It's still one of my favorites.

There's a lot of these floating around with slightly different ranges. I'm not even sure if this one is the most/least accurate. I did like the colors though. I would try to settle my PH around 5.6-5.7 and let it drift up to 6.3-6.4 before resetting it. (F&D)
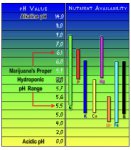

I'm a soil guy but recently ventured into hydro. This chart was clutch for me. It's still one of my favorites.

There's a lot of these floating around with slightly different ranges. I'm not even sure if this one is the most/least accurate. I did like the colors though. I would try to settle my PH around 5.6-5.7 and let it drift up to 6.3-6.4 before resetting it. (F&D)

Gweedo's Growroom
Yoda Fired Up
Those 3 are the ones I pretty much love by ???
Agreed. Especially the middle one. Great tool, keeps you on your toes with a "live read" pH/ppm meter like a Bluelab Guardian.Those 3 are the ones I pretty much love by ???
My environment has shitty extremes so I haven't been able to run with VPD yet. The high humidity has been a challenge especially with a shit ton of water and hungry, transpiring plants under HIDs lol.
The last chart is different than this other common one:
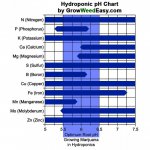
Phylex and I run similar ph/ppm ranges.
Badmofo529
In Bloom
This is mainly for non-hydro right? If I creep above 800 PPM at any time in hydro, I will get nute lock.
These were actually from a current culture system I set up for a friend..
 cch2o.com
General Recommendations - Current Culture H2O
CCH2O Reference Guide For General Recommendations For Cultivation ,Optimal Deep Water Culture and Recirculating Deep Water Culture Systems
Last edited:
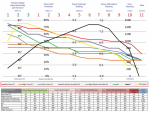
Very interesting, good reference to have, it differs from what I've been running by quite a bit. Week 6 of flower, they are recommending to push 1500 PPM, man that's insanely high at least for me. The only way I can think of getting in the 1000s is to get that water really cold, looks like they're recommending to run at 68F even at the peak of PPM, then drop it even colder after week 6 as the PPM drifts down (against what I've experienced, but they invented the system so they would know better). They're staying above 1000 PPM into week 9. I don't run their nutes so maybe that's the difference? Both GH3 and Megacrop have given me issues in the higher PPM range, I got above 1000 PPM once, but not for long, and that's with the water chilled to 64F.These were actually from a current culture system I set up for a friend..
General Recommendations - Current Culture H2O
CCH2O Reference Guide For General Recommendations For Cultivation ,Optimal Deep Water Culture and Recirculating Deep Water Culture Systemscch2o.com
Looking at it again, their chart shows 0.9 EC = ~1000 PPM. Using Bluelab's conversion chart:
Even at the 700 scale, EC 1.0 = 700 PPM. So wonder what conversion they are using? It's like PPM is doubled (on the 500 scale) or something, which would be more on par with what I've been running.
I think you're looking at co2?Very interesting, good reference to have, it differs from what I've been running by quite a bit. Week 6 of flower, they are recommending to push 1500 PPM, man that's insanely high at least for me. The only way I can think of getting in the 1000s is to get that water really cold, looks like they're recommending to run at 68F even at the peak of PPM, then drop it even colder after week 6 as the PPM drifts down (against what I've experienced, but they invented the system so they would know better). They're staying above 1000 PPM into week 9. I don't run their nutes so maybe that's the difference? Both GH3 and Megacrop have given me issues in the higher PPM range, I got above 1000 PPM once, but not for long, and that's with the water chilled to 64F.
Looking at it again, their chart shows 0.9 EC = ~1000 PPM. Using Bluelab's conversion chart:
View attachment 5848
Even at the 700 scale, EC 1.0 = 700 PPM. So wonder what conversion they are using? It's like PPM is doubled (on the 500 scale) or something, which would be more on par with what I've been running.
The way I read it highest ec is 1.4-1.5 which would only be 1050 on the 700 scale.
ahh didn't see that CO2 before PPM, my eyes just saw the PPM part. So there is no PPM conversion there just the EC. In which case right on with what I've experienced as well. Good callout man.I think you're looking at co2?
The way I read it highest ec is 1.4-1.5 which would only be 1050 on the 700 scale.
Interesting how the CO2 is just about double what the PPM would be on the 500 scale.
Similar threads
- Replies
- 13
- Views
- 247

